


Data tools built for growers.
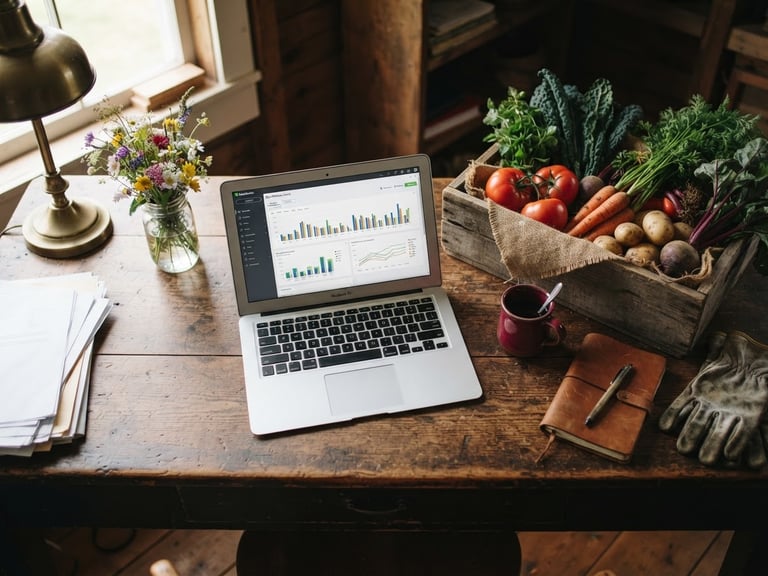
Track crop profitability.
Compare seasonal labor costs against actual harvest yields. Our custom dashboards map your QuickBooks ledger to specific fields, showing which crops carry your farm's margins.
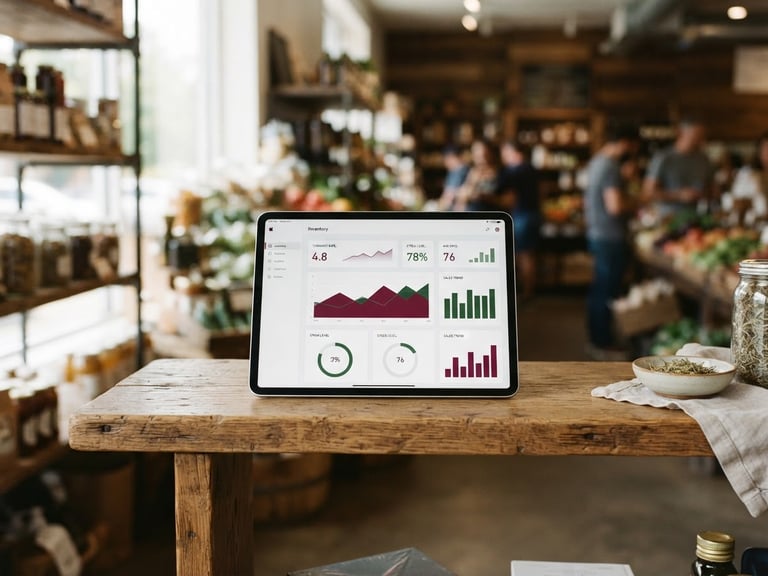
Optimize market shelf space.
Identify slow-moving inventory and track unit economics for boutique grocery items. See which products justify their shelf space and where your capital is tied up.
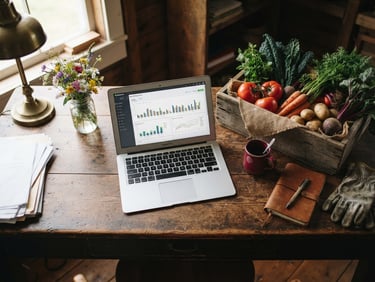
Unify multi-channel sales.
Consolidate revenue streams from farmers markets, wholesale accounts, and CSA subscriptions. We sync these diverse channels directly into one visual interface.
We finally see exactly which crops pay for their labor and which ones we should stop planting. The clarity is instant.
Silas B., Organic Farm Director
Bring clarity to your next harvest.
Stop guessing your margins. Let's connect your QuickBooks Online data to a custom visual dashboard built for the food industry.
Finsync Analytics
QuickBooks-native visual dashboards for independent food businesses.
Home-Solutions-Contact
Get in touch
hello@finsyncanalytics.com
Based in Portland, OR
Available for remote integrations
© 2026 Finsync Analytics-Down-to-earth data engineering for the food industry.
Ledger-to-visual clarity