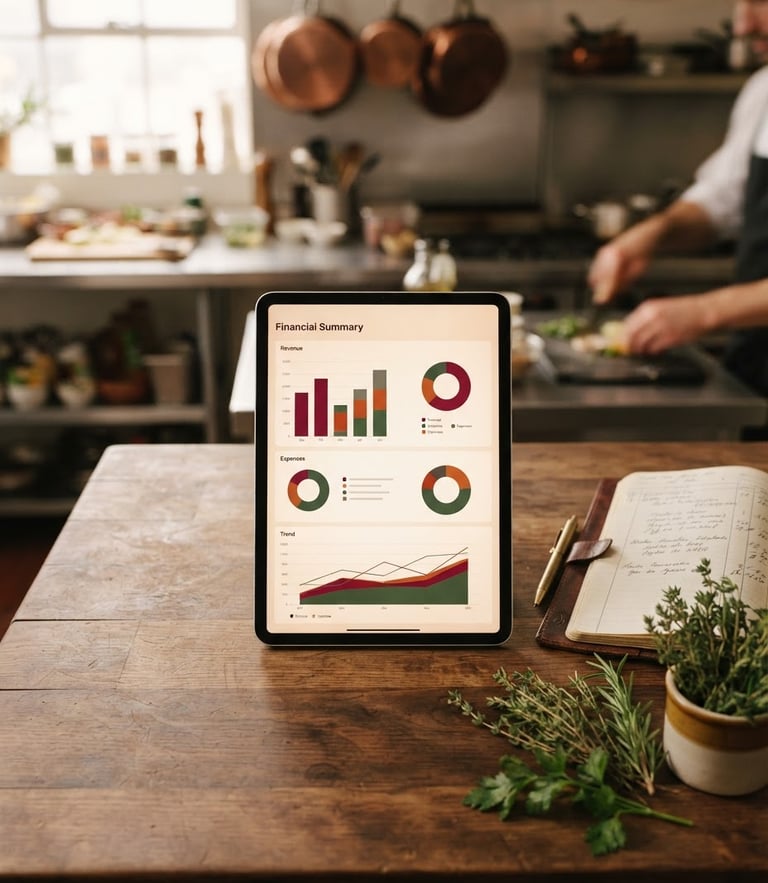
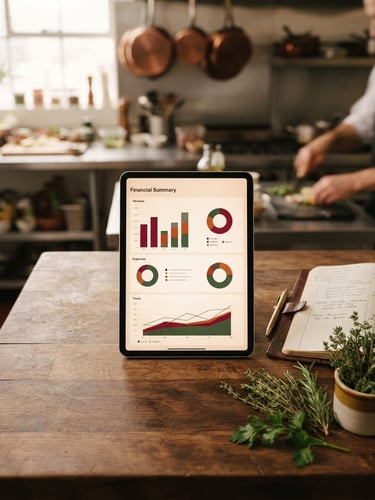
Dashboards built for food margins
We connect your QuickBooks Online ledger directly to custom, Scandinavian-designed visual reports. See your plate costs, harvest yields, and daily operational margins at a glance.
Solutions by sector
Every food business has unique metrics. We design custom visual systems that map your point-of-sale and payroll data directly to QuickBooks Online.
Restaurants
Farms & Growers
Modern Markets
Track real-time plate costs, labor spend, and seasonal menu profitability. We turn complex POS transactions into daily visual margin reports.
Visualize harvest yields, soil-to-shelf margins, and seasonal labor costs. Keep your farm ledger clear, automated, and ready for growth.
Monitor inventory turnover, waste metrics, and department-level profitability. Connect your retail registers directly to your financial dashboard.
Our integration process
Connect ledger
Map metrics
Launch dashboard
We link your existing QuickBooks Online account and point-of-sale systems securely to our secure data pipeline.
Our engineers translate your raw operational numbers into clean, structured food-industry data models.
Access your custom, Scandinavian-designed financial dashboards on any device with automated daily reports.
Ready for operational clarity?
Schedule a brief consultation to discuss your QuickBooks setup and discover how custom dashboards can protect your margins.
Finsync Analytics
QuickBooks-native visual dashboards for independent food businesses.
Home-Solutions-Contact
Get in touch
hello@finsyncanalytics.com
Based in Portland, OR
Available for remote integrations
© 2026 Finsync Analytics-Down-to-earth data engineering for the food industry.
Ledger-to-visual clarity