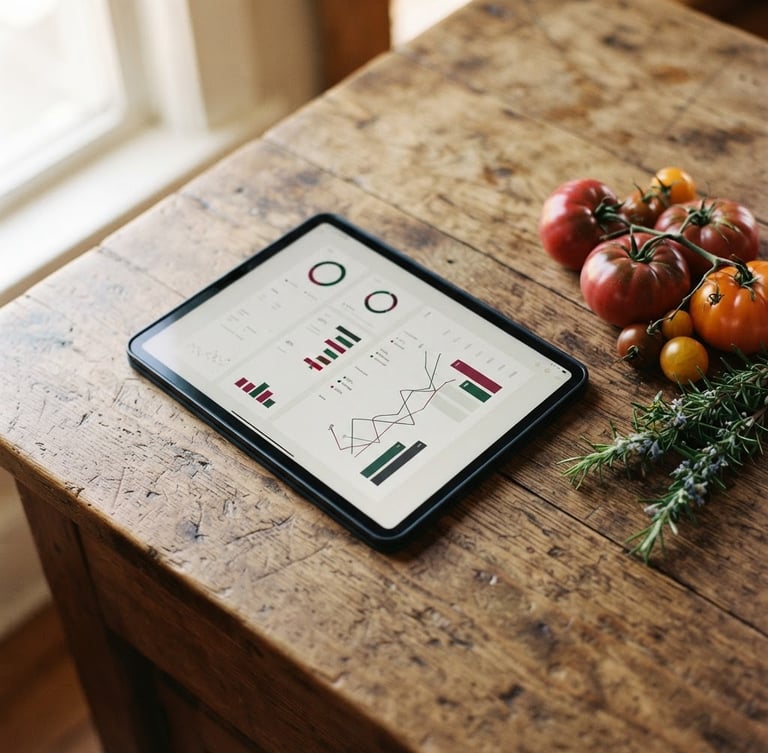
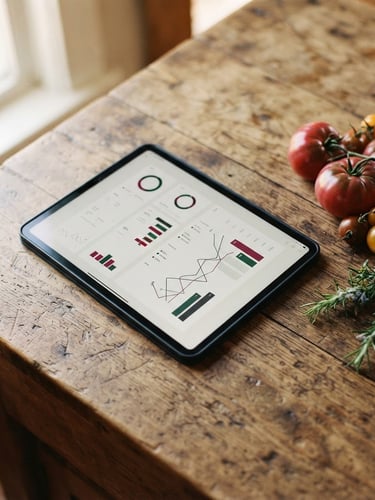
From ledger to visual clarity.
We connect your QuickBooks Online ledger directly to custom, Scandinavian-designed visual dashboards built exclusively for independent food producers, local farms, and artisanal restaurants. Stop digging through nested sub-accounts and see your actual plate-cost margins instantly.
Data built for food economics
Stop drowning in spreadsheets. Our custom integrations pull your financial data out of QuickBooks and present it in beautifully simple, actionable visual dashboards.
Artisanal Kitchens
Local Producers
Modern Markets
Track plate-cost margins, daily labor ratios, and ingredient waste. See exactly what it costs to plate your signature dishes tonight.
Monitor harvest yields, wholesale distribution channels, and seasonal cash flow. Move from guesswork to margin-first farming with real-time operational metrics.
Analyze basket size, inventory turnover, and vendor performance. Keep your shelves optimized and your waste minimized with clean, visual charts.
Clarity in the numbers
14%
average margin increase
8 hrs
saved weekly on bookkeeping
100%
QuickBooks Online native
Ready for margin clarity?
We connect your QuickBooks setup to custom dashboards in days, not months. Let's map your operational blindspots together.
Finsync Analytics
QuickBooks-native visual dashboards for independent food businesses.
Home-Solutions-Contact
Get in touch
hello@finsyncanalytics.com
Based in Portland, OR
Available for remote integrations
© 2026 Finsync Analytics-Down-to-earth data engineering for the food industry.
Ledger-to-visual clarity